cmonitor
A Docker/LXC/Kubernetes, database-free, lightweight container performance monitoring solution, perfect for ephemeral containers (e.g. containers used for DevOps automatic testing). Can also be used with InfluxDB, Prometheus and Grafana
![]()

cmonitor - lightweight container monitor
A Docker, LXC, Kubernetes, database-free, lightweight container performance monitoring solution, perfect for ephemeral containers (e.g. containers used for DevOps automatic testing). Can also be used with InfluxDB, Prometheus and Grafana to monitor long-lived containers in real-time.
The project is composed by 2 parts:
1) a lightweight agent (80KB native binary when built without Prometheus support; no JVM, Python or other interpreters needed) to collect actual CPU/memory/disk statistics (Linux-only)
and store them in a JSON file or stream them to a time-series database (InfluxDB and Prometheus are supported); this is the so-called cmonitor-collector utility;
2) some simple Python tools to process the generated JSONs; the most important one is “cmonitor_chart” that turns the JSON into a self-contained HTML page
using Google Charts to visualize all collected data.
The collector utility is a cgroup-aware statistics collector; cgroups (i.e. Linux Control Groups) are the basic Linux technology used
to create containers (you can read more on them here); this project thus aims at
monitoring your LXC/Docker/Kubernetes POD container performances by monitoring only the cgroup-level kernel-provided stats.
However, considering that systemd runs all software inside cgroups, cmonitor-collector can also be used to sample statistics about
a software running outside any “containerization” technology (like LXC, Docker or Kubernetes).
This project supports only Linux x86_64 architectures.
Table of contents of this README:
- cmonitor - lightweight container monitor
- Features
- Yet-Another-Monitoring-Project?
- Supported Linux Kernels
- How to install
- How to build from sources
- How to use
- Project History
- License
Features
This project collects performance data sampling system-wide Linux statistic files (i.e. sampling /proc):
- per-CPU-core usage;
- memory usage (and memory pressure information);
- network traffic (PPS and MB/s or Mbps);
- disk load;
- average Linux load;
and can sample cgroup-specific (read: container-specific) statistics from /sys/fs/cgroup like:
- CPU usage as reported by the
cpuacct(CPU accounting) cgroupv1 or by thecpucgroupv2; - CPU throttling reported under
cpuacctcgroup; - CPU usage per-process and per-thread (useful for multithreaded application monitoring);
- memory usage and memory pressure information as reported by the
memorycgroup; - network usage measured by sampling the network interfaces associated to a cgroup network namespace;
- disk usage as reported by the
blkiocgroup;
The collector of statistics can be configured to collect all or a subset of above statistics. Moreover sub-second sampling is possible and up to 100 samples/sec can be collected in some cases (sampling all stats for a docker container typically takes around 1msec). This allow to explore fast transients in CPU/memory/network usage.
Finally the project allows you to easily post-process collected data to:
- produce a self-contained HTML page which allows to visualize all the performance data easily using Google Charts;
- extract statistics information e.g. average/median/peak CPU usage and CPU throttling, average/median/peak memory usage etc;
- hold large amounts of statistics when connected to time-series databases like InfluxDB and Prometheus.
Yet-Another-Monitoring-Project?
You may be thinking “yet another monitoring project” for containers. Indeed there are already quite a few open source solutions, e.g.:
- cAdvisor: a Google-sponsored utility to monitor containers
- netdata: a web application targeting monitoring of large clusters
- collectd: a system statics collection daemon (not much container-oriented though)
- metrics-server: the Kubernetes official metric server (Kubernetes only)
- process-exporter: an utility to export generic processes’ stats to Prometheus
Almost all of these are very complete solutions that allow you to monitor swarms of containers, in real time. The downside is that all these projects require you to setup an infrastructure (usually a time-series database) that collects in real-time all the statistics and then have some powerful web platform (e.g. Graphana) to render those time-series. All that is fantastic for persistent containers.
This project instead is focused on providing a database-free, lightweight container performance monitoring solution, perfect for ephemeral containers (e.g. containers used for DevOps automatic testing). The idea is much simpler: 1) you collect data for your container (or, well, your physical server) using a small collector software (written in C++ to avoid Java virtual machines, Python interpreters or the like!) that saves data on disk in JSON format; 2) whenever needed, the JSON can be either converted to a self-contained HTML page for human inspection or some kind of algorithm can be run to perform targeted analysis (e.g. imagine you need to search for time ranges where high-CPU usage was combined with high-memory usage or where instead CPU usage was apparently low but CPU was throttled due to cgroup limits); 3) the human-friendly HTML file, or the result of the analysis, can be then sent by email, stored in a tarball or as “artifact” of your CI/CD. The idea is that these post-processing results will have no dependencies at all with any infrastructure, so they can be consumed anywhere at anytime (in other words you don’t need to make a time-series database available 24/7 to go and dig performance results of your containers).
Moreover, cmonitor is the only tool (to the best of author’s knowledge) that can collect CPU usage of multithreaded applications with per-thread granularity.
Supported Linux Kernels
Cmonitor version 2.0 and higher supports both cgroups v1 and cgroups v2.
This means that the cmonitor-collector utility can run on any Linux kernel regardless of its version and its boot options
(since boot options may alter the cgroups technology in use).
Note that cmonitor-collector utility is currently unit-tested against:
- cgroups created by Docker/systemd on Centos 7 (Linux kernel v3.10.0), click here for more info
- cgroups created by Docker/systemd on Ubuntu 20.04 (Linux kernel v5.4.0), click here for more info
- cgroups created by Docker/systemd on Fedora 35 (Linux kernel v5.14.17), click here for more info
Other kernels will be tested in near future. Of course pull requests are welcome to extend coverage.
Regarding cgroup driver, cmonitor-collector is tested against both the cgroupfs driver (used e.g. by Docker to create cgroups
for containers using cgroups v1) and the systemd driver (which creates cgroups for the baremetal environment, not for containers).
To find out which cgroup driver and which cgroup version you are using when launching e.g. Docker containers you can run:
docker info | grep -i cgroup
You may also be interested in this article https://lwn.net/Articles/676831/ for more details on the docker vs systemd friction in Linux world.
How to install
RPM (for Fedora, Centos)
You can get started with cmonitor by installing a native RPM. This project uses COPR repository for maintaining always up-to-date RPMs for Fedora and Centos distributions. Just run:
yum install -y yum-plugin-copr
yum copr enable -y f18m/cmonitor
yum install -y cmonitor-collector cmonitor-tools
(or use dnf if you prefer).
Note that the RPM cmonitor-collector has no dependencies from Python and has very small set of dependencies (GNU libc and few others)
so can be installed easily everywhere. The RPM cmonitor-tools instead requires Python3.
Finally note that Fedora COPR infrastructure will retain only the very latest version of cmonitor RPMs. If your CI/CD relies on a particular version of cmonitor, the suggestion is to download and store the RPM version you need.
Debian package (for Debian, Ubuntu, etc)
You can get started with cmonitor by installing it as a Debian package. The debian packages are built using Ubuntu private PPA service. Just run:
add-apt-repository ppa:francesco-montorsi/cmonitor
apt-get install cmonitor-collector cmonitor-tools
Note that the debian package cmonitor-collector has no dependencies from Python and has very small set of dependencies (GNU libc and few others)
so can be installed easily everywhere. The debian package cmonitor-tools instead requires Python3.
WARNING: I’m having troubles maintaining both the RPM, docker and Ubuntu packaging for this project, so typically the Ubuntu (.deb) package is updated only later, when I have time. If you want to test very latest cmonitor release as .deb please let me know, I might be able to push the latest release in my PPA.
Docker
Alternatively to native packages, you can use cmonitor_collector utility as a Docker:
docker run -d \
    --rm \
    --name=cmonitor-baremetal-collector \
    --network=host \
    --pid=host \
    --volume=/sys:/sys:ro \
    --volume=/etc/os-release:/etc/os-release:ro \
    --volume=$(pwd):/perf:rw \
    f18m/cmonitor:latest \
    --sampling-interval=1  ...
which runs the Docker image for this project from Docker Hub.
Note that the Dockerfile entrypoint is cmonitor_collector and thus any supported CLI option can be provided
at the end of the docker run command.
The volume mount of /etc/os-release and the --network=host option are required to allow cmonitor_collector to correctly identify the real host
being monitored (otherwise cmonitor_collector reports the randomly-generated hash by Docker for the hostname).
The --pid=host option is required to allow cmonitor_collector to monitor processes generated by other containers.
Finally, the volume mount of /sys exposes all the cgroups of baremetal into the cmonitor_collector docker and thus enables the collector
utility to access the stats of all other running containers; this is required by similar tools as well like cAdvisor.
How to build from sources
The build process is composed by 2 steps, as for most projects: 1) install dependencies 2) compile cmonitor C/C++ code
The step 1 changes very much depending on whether you want to enable the Prometheus integration or not. Indeed to support prometheus the prometheus-cpp client library needs to be installed, together with all its dependencies (civetweb, openSSL, libcurl). Since prometheus-cpp library is not packaged in most distributions (at least as of Aug 2022) we use Conan package manager to fetch the prometheus-cpp Conan package. If you are confident with Conan you can thus build from sources with Prometheus support by using PROMETHEUS_SUPPORT=1 flag to GNU make. If instead you are not interested in Prometheus support or you have troubles with Conan, it’s suggested to build with PROMETHEUS_SUPPORT=0 flag to GNU make.
On Fedora, Centos
First of all, checkout this repository on your Linux box using git or decompressing a tarball of a release. Then run:
# install compiler tools & library dependencies with YUM:
sudo dnf install -y gcc-c++ make gtest-devel fmt-devel google-benchmark-devel

# install dependencies with Conan:
# (this part can be skipped if you are not interested in Prometheus support)
pip3 install conan
conan profile new default --detect
conan profile update settings.compiler.libcxx=libstdc++11 default
conan install . --build=missing
# if all Conan steps were successful, then enable Prometheus support:
export PROMETHEUS_SUPPORT=1

# finally build cmonitor C/C++ code:
make all -j
make test                                         # optional step to run unit tests
sudo make install DESTDIR=/usr/local BINDIR=bin   # to install in /usr/local/bin
On Debian, Ubuntu
First of all, checkout this repository on your Linux box using git or decompressing a tarball of a release. Then run:
sudo apt install -y libgtest-dev libbenchmark-dev python3 libfmt-dev g++
make all -j
make test                                    # optional step to run unit tests
sudo make install DESTDIR=/usr/local BINDIR=bin   # to install in /usr/local/bin
How to use
Step 1: collect stats
The RPM/Debian packages “cmonitor-collector” install a single utility, named cmonitor_collector.
It can be launched as simply as:
cmonitor_collector --sampling-interval=3 --output-directory=/home
(on baremetal) or as a Docker:
docker run -d \
    --rm \
    --name=cmonitor-baremetal-collector \
    --network=host \
    --pid=host \
    --volume=/sys:/sys:ro \
    --volume=/etc/os-release:/etc/os-release:ro \
    --volume=/home:/perf:rw \
    f18m/cmonitor:latest \
    --sampling-interval=1  ...
to produce in the /home folder a JSON with CPU/memory/disk/network stats for the container
sampling all supported performance statistics every 3 seconds.
Once the JSON is produced, next steps are either:
- inject that JSON inside InfluxDB (mostly useful for persistent containers that you want to monitor in real-time); see section “Connecting with InfluxDB and Grafana” below;
- or use the
cmonitor_chartutility to convert that JSON into a self-contained HTML file (mostly useful for ephemeral containers); see below for practical examples.
See supported CLI option section for complete list of accepted options.
Step 2: plot stats collected as JSON
To plot the JSON containing the collected statistics, simply launch the cmonitor_chart utility installed together
with the RPM/Debian package, with the JSON collected from cmonitor_collector:
cmonitor_chart --input=/path/to/json-stats.json --output=<optional HTML output filename>
Note that to save space/bandwidth you can also gzip the JSON file and pass it gzipped directly to cmonitor_chart.
Usage scenarios and HTML result examples
Monitoring the baremetal server (no containers)
If you want to monitor the performances of an entire server (or worker node in Kubernetes terminology), you can either:
a) install cmonitor_collector as RPM or APT package following instructions or
b) use cmonitor_collector as a Docker;
See How to install for more information.
Example results:
1) baremetal1:
example of graph generated with the performance stats collected from a physical (baremetal) server by running cmonitor_collector installed as RPM;
note that despite the absence of any kind of container, the cmonitor_collector utility (like just any other software in
modern Linux distributions) was running inside the default “user.slice” cgroup and collected both the stats of that cgroup
and all baremetal stats (which in this case mostly coincide since the “user.slice” cgroup contains almost all running processes of the server);
2) baremetal2:
This is a longer example of collected statistics (results in a larger file, may take some time to download) generated
with 9 hours of performance stats collected from a physical server running Centos7 and with 56 CPUs (!!);
the cmonitor_collector utility was installed as RPM and running inside the default “user.slice” cgroup so both “CGroup” and “Baremetal”
graphs are present;
3) docker_collecting_baremetal_stats:
example of graph generated with the performance stats collected from a physical server from cmonitor_collector Docker container;
in this case cgroup stat collection was explicitely disabled so that only baremetal performance graphs are present;
see Docker installation information as reference how the docker was started.
Monitoring your Docker container
In this case you can simply install cmonitor as RPM or APT package following instructions in How to install
and then launch the cmonitor_collector utility as any other Linux daemon, specifying the name of the cgroup associated with
the docker container to monitor.
Finding out the cgroup associated with a Docker container can require some detailed information about your OS / runtime configuration;
for example you should know whether you’re using cgroups v1 or v2 and which Docker cgroup driver are you using (cgroupfs or systemd);
please see the official Docker page
for more details.
In the following example a Redis docker container is launched with the name ‘userapp’ and its
CPU, memory, network and disk usage are monitored launching a cmonitor_collector instance:
docker run --name userapp --detach redis:latest

DOCKER_ID=$(docker ps -aq --no-trunc -f "name=userapp")

CGROUP_NAME=docker/${DOCKER_ID}                       # when 'cgroupfs' driver is in use
CGROUP_NAME=system.slice/docker-${DOCKER_ID}.scope    # when 'systemd' driver is in use

# here we exploit the following fact: the cgroup of each Docker container
# is always named 'docker/container-ID'... at least when using Moby engine
cmonitor_collector \
   --num-samples=until-cgroup-alive \
   --cgroup-name=${CGROUP_NAME} \
   --collect=cgroup_threads,cgroup_cpu,cgroup_memory,cgroup_network --score-threshold=0 \
   --custom-metadata=cmonitor_chart_name:userapp \
   --sampling-interval=3 \
   --output-filename=docker-userapp.json
Alternatively the Redis Docker container (or any other one) can be monitored from cmonitor_collector running as a Docker itself:
docker run -d \
    --rm \
    --name=cmonitor-collector \
    --network=host \
    --pid=host \
    --volume=/sys:/sys:ro \
    --volume=/etc/os-release:/etc/os-release:ro \
    --volume=/home:/perf:rw \
    f18m/cmonitor:latest \
   --num-samples=until-cgroup-alive \
   --cgroup-name=${CGROUP_NAME} \
   --collect=cgroup_threads,cgroup_cpu,cgroup_memory,cgroup_network --score-threshold=0 \
   --custom-metadata=cmonitor_chart_name:userapp \
   --sampling-interval=3 \
   --output-filename=docker-userapp.json
See Docker usage paragraph for more info about the “docker run” options required.
See example #4 below to view the results produced by using the cmonitor_collector Docker with the command above.
Example results:
1) docker_userapp: example of the chart generated by monitoring
from the baremetal a simple Redis docker simulating a simple application, doing some CPU and I/O. In this example the
--collect=cgroup_threads is further used to show Redis CPU usage by-thread.
2) docker_stress_test_cpu: example of the chart generated by monitoring from the baremetal a stress-ng Docker with a CPU limit set. This example shows how cmonitor will report “CPU throttling” and how useful it is to detect cases where a Docker is trying to use too much CPU.
3) docker_stress_test_memory: example of the chart generated by monitoring from the baremetal a stress-ng Docker with a MEMORY limit set. This example shows how cmonitor will report “Memory allocation failures” and how useful it is to detect cases where a Docker is trying to use too much memory.
4) docker_collecting_docker_stats: example of the chart generated
by monitoring from cmonitor_collector Docker a Redis Docker.
This example shows how cmonitor is able to run as a Docker-monitoring-other-Dockers.
Monitoring your Kubernetes POD
In this case you can simply install cmonitor as RPM or APT package following instructions in How to install
on all the worker nodes where Kubernetes might be scheduling the POD you want to monitor.
Then, you can launch the cmonitor_collector utility as any other Linux daemon, specifying the name of the cgroup associated
with the Kubernetes POD (or more precisely, associated with one of the containers inside the Kubernetes POD, in case it contains
also sidecar containers).
Finding the name of the cgroup associated with your POD is tricky. It depends on the specific Kubernetes Container Runtime Interface
(CRI), but the following example shows a generic-enough procedure:
PODNAME=<your-pod-name>
CONTAINERNAME=<main-container-name>
CONTAINERID=$(kubectl get pod ${PODNAME} -o json | jq -r ".status.containerStatuses[] | select(.name==\"${CONTAINERNAME}\") | .containerID" | sed  's@containerd://@@')
FULL_CGROUP_NAME=$(find /sys/fs/cgroup -name ${CONTAINERID} | head -1 |sed 's@/sys/fs/cgroup/memory/@@')

cmonitor_collector \
   --num-samples=until-cgroup-alive \
   --cgroup-name=${FULL_CGROUP_NAME} \
   --collect=cgroup_threads,cgroup_cpu,cgroup_memory --score-threshold=0 \
   --custom-metadata=cmonitor_chart_name:${PODNAME} \
   --sampling-interval=3 \
   --output-filename=pod-performances.json
Connecting with InfluxDB and Grafana
The cmonitor_collector can be connected to an InfluxDB deployment to store collected data (this can happen
in parallel to the JSON default storage). This can be done by simply providing the IP and port of the InfluxDB instance when launching
the collector:
cmonitor_collector \
   --remote-ip 1.2.3.4 --remote-port 8086 --remote influxdb
The InfluxDB instance can then be used as data source for graphing tools like Grafana which allow you to create nice interactive dashboards like the following one:
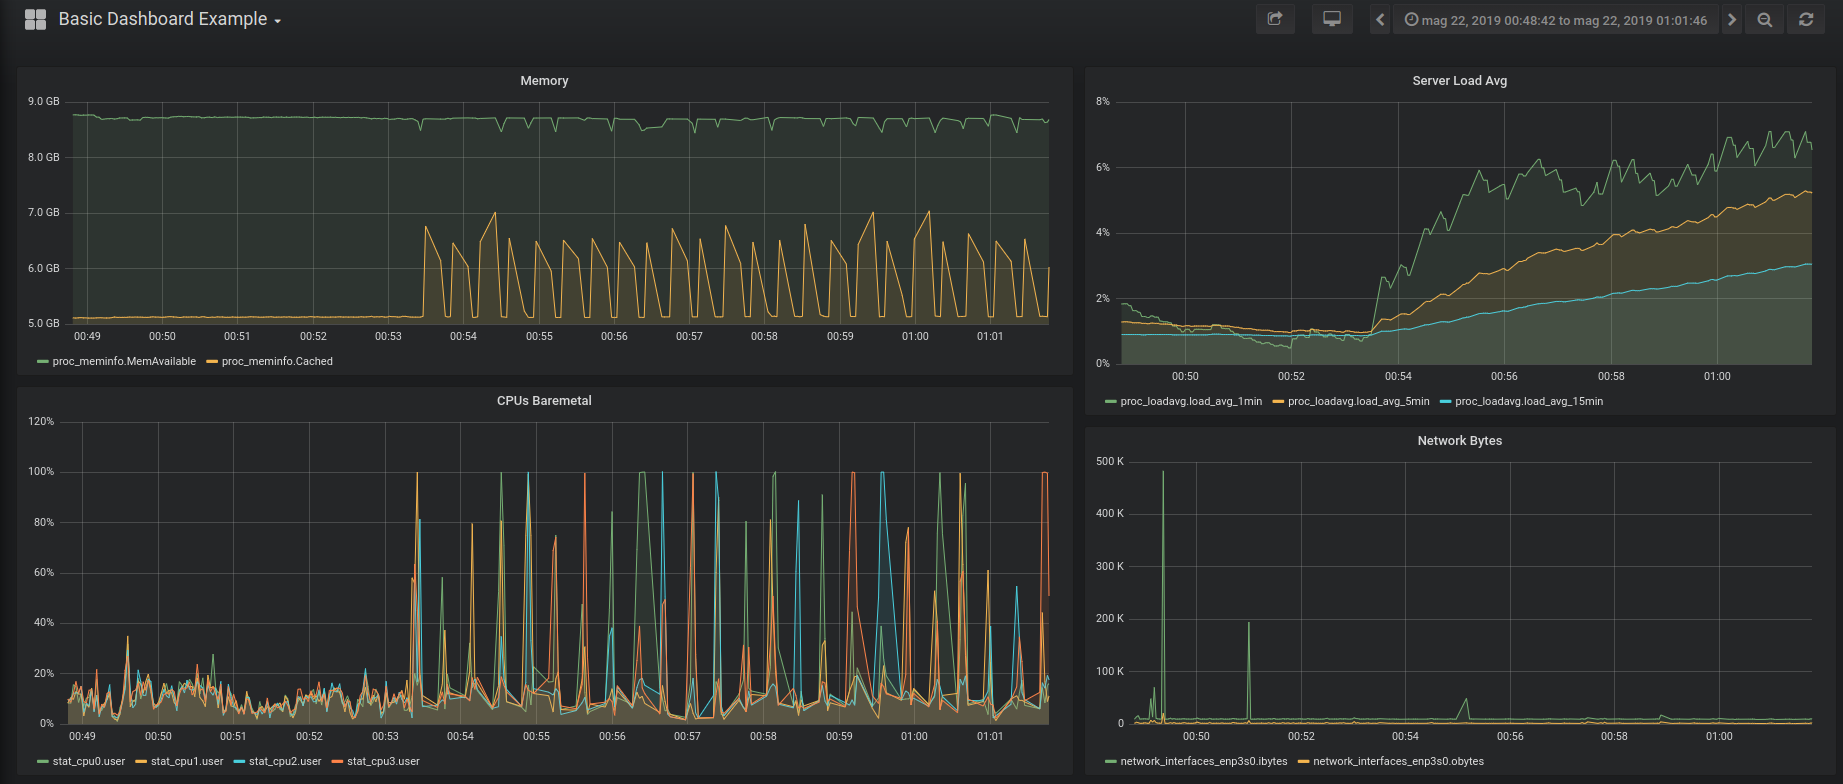
You can also play with the live dashboard example
To setup easily and quickly the chain “cmonitor_collector-InfluxDB-Grafana” you can checkout the repo of this project and run:
make -C examples regen_grafana_screenshots
which uses Docker files to deploy a temporary setup and fill the InfluxDB with 10minutes of data collected from the baremetal.
Connecting with Prometheus and Grafana
The cmonitor_collector can be connected to a Prometheus instance to store collected data (this can happen
in parallel to the JSON default storage). This can be done by simply providing the IP and port for the Prometheus instance when launching the collector:
cmonitor_collector \
   --remote-ip 10.1.2.3 --remote-port 9092 --remote prometheus
The Prometheus instance can then be used as data source for graphing tools like Grafana which allow you to create nice interactive dashboards (see examples in InfluxDB section).
Reference Manual
The most detailed documentation on how to use cmonitor tool is available from --help option:
cmonitor_collector: Performance statistics collector.
List of arguments that can be provided follows:

Data sampling options
  -s, --sampling-interval=<REQ ARG>     Seconds between samples of data (default is 60 seconds). Minimum value is 0.01sec, i.e. 10msecs.
  -c, --num-samples=<REQ ARG>           Number of samples to collect; special values are:
                                           '0': means forever (default value)
                                           'until-cgroup-alive': until the cgroup selected by --cgroup-name is alive
  -k, --allow-multiple-instances        Allow multiple simultaneously-running instances of cmonitor_collector on this system.
                                        Default is to block attempts to start more than one background instance.
  -F, --foreground                      Stay in foreground.
  -C, --collect=<REQ ARG>               Collect specified list of performance stats. Available performance stats are:
                                          'cpu': collect per-core CPU stats from /proc/stat
                                          'memory': collect memory stats from /proc/meminfo, /proc/vmstat
                                          'disk': collect disk stats from /proc/diskstats
                                          'network': collect network stats from /proc/net/dev
                                          'load': collect system load stats from /proc/loadavg
                                          'cgroup_cpu': collect CPU stats from the 'cpuacct' cgroup
                                          'cgroup_memory': collect memory stats from 'memory' cgroup
                                          'cgroup_network': collect network statistics by interface for the network namespace of the cgroup
                                          'cgroup_processes': collect stats for each process inside the 'cpuacct' cgroup
                                          'cgroup_threads': collect stats for each thread inside the 'cpuacct' cgroup
                                          'all_baremetal': the combination of 'cpu', 'memory', 'disk', 'network'
                                          'all_cgroup': the combination of 'cgroup_cpu', 'cgroup_memory', 'cgroup_processes'
                                          'all': the combination of all previous stats (this is the default)
                                        Note that a comma-separated list of above stats can be provided.
  -e, --deep-collect                    Collect all available details for the performance statistics enabled by --collect.
                                        By default, for each category, only the stats that are used by the 'cmonitor_chart' companion utility
                                        are collected. With this option a more detailed but larger JSON / InfluxDB data stream is produced.
  -g, --cgroup-name=<REQ ARG>           If cgroup sampling is active (--collect=cgroups*), this option allows to provide explicitly the name of
                                        the cgroup to monitor. If 'self' value is passed (the default), the statistics of the cgroups where
                                        cmonitor_collector runs will be collected. Note that this option is mostly useful when running
                                        cmonitor_collector directly on the baremetal since a process running inside a container cannot monitor
                                        the performances of other containers.
  -t, --score-threshold=<REQ ARG>       If cgroup process/thread sampling is active (--collect=cgroup_processes/cgroup_threads) use the provided
                                        score threshold to filter out non-interesting processes/threads. The 'score' is a number that is linearly
                                        increasing with the CPU usage. Defaults to '1' to filter out all processes/threads having zero CPU usage.
                                        Use '0' to turn off filtering by score.
  -M, --custom-metadata=<REQ ARG>       Allows to specify custom metadata key:value pairs that will be saved into the JSON output (if saving data
                                        locally) under the 'header.custom_metadata' path. Can be used multiple times. See usage examples below.

Options to save data locally
  -m, --output-directory=<REQ ARG>      Write output JSON and .err files to provided directory (defaults to current working directory).
  -f, --output-filename=<REQ ARG>       Name the output files using provided prefix instead of defaulting to the filenames:
                                                hostname_<year><month><day>_<hour><minutes>.json  (for JSON data)
                                                hostname_<year><month><day>_<hour><minutes>.err   (for error log)
                                        Special argument 'stdout' means JSON output should be printed on stdout and errors/warnings on stderr.
                                        Special argument 'none' means that JSON output must be disabled.
  -P, --output-pretty                   Generate a pretty-printed JSON file instead of a machine-friendly JSON (the default).

Options to stream data remotely
  -r, --remote=<REQ ARG>                Set the type of remote target: 'none' (default), 'influxdb' or 'prometheus'.
  -i, --remote-ip=<REQ ARG>             When remote is InfluxDB: IP address or hostname of the InfluxDB instance to send measurements to;
                                        When remote is Prometheus: listen address, defaults to 0.0.0.0 (to accept connections from all).
  -p, --remote-port=<REQ ARG>           When remote is InfluxDB: port of server;
                                        When remote is Prometheus: listen port, defaults to 8080.
  -X, --remote-secret=<REQ ARG>         InfluxDB only: set the collector secret (by default use environment variable CMONITOR_SECRET).
  -D, --remote-dbname=<REQ ARG>         InfluxDB only: set the InfluxDB database name (default is 'cmonitor').

Other options
  -v, --version                         Show version and exit
  -d, --debug                           Enable debug mode; automatically activates --foreground mode
  -h, --help                            Show this help

Examples:
    1) Collect data from OS every 5 mins all day:
        cmonitor_collector -s 300 -c 288 -m /home/perf
    2) Use the defaults (-s 60, collect forever), saving to custom file in background:
        cmonitor_collector --output-filename=my_server_today
    3) Collect data from a docker container:
        DOCKER_NAME=your_docker_name
        DOCKER_ID=$(docker ps -aq --no-trunc -f "name=$DOCKER_NAME")
        cmonitor_collector --allow-multiple-instances --num-samples=until-cgroup-alive
                        --cgroup-name=docker/$DOCKER_ID --custom-metadata='cmonitor_chart_name:$DOCKER_NAME'
                        --custom-metadata='additional_metadata:some-data'
    4) Monitor a docker container sending data to an InfluxDB (only, no JSON output):
        cmonitor_collector --num-samples=until-cgroup-alive --cgroup-name=docker/$DOCKER_ID
                        --output-filename=none --remote=influxdb --remote-ip myinfluxdb.foobar.com --remote-port 8086
    5) Monitor a docker container and expose HTTP endpoint for Prometheus scraping (no JSON output):
        cmonitor_collector -s 5 --num-samples=until-cgroup-alive --cgroup-name=docker/$DOCKER_ID
                        --output-filename=none --remote=prometheus  --collect=all_cgroup --score-threshold=0
        curl http://localhost:8080/metrics # test scraping
    6) Pipe into 'myprog' half-a-day of sampled performance data:
        cmonitor_collector --sampling-interval=30 --num-samples=1440 --output-filename=stdout --foreground | myprog

NOTE: this is the cgroup-aware fork of original njmon software (see https://github.com/f18m/cmonitor)
Project History
This project started as a fork of Nigel’s performance Monitor for Linux, adding cgroup-awareness;
but it has quickly evolved to a point where it shares very little code pieces with the original njmon tool.
Some key differences now include:
- cgroup-aware: several performance cgroup stats are collected by
cmonitor_collectorand plotted bycmonitor_chart - more command-line options for
cmonitor_collector; - HTML page generated by
cmonitor_chartdifferently organized; cmonitor_collectoris able to connect to InfluxDB directly and does not need intermediate Python scripts to transform from JSON streamed data to InfluxDB-compatible stream.- Prometheus support
This fork supports only Linux x86_64 architectures; support for AIX/PowerPC (present in original nmon) has been dropped.
- Original project: http://nmon.sourceforge.net
- Other forks: https://github.com/axibase/nmon
License
Just like the original project, this project is licensed under GNU GPL 2.0